
Ladies and gentlemen, welcome to our discussion on the correlation between some key Hull MA real estate metrics that are of utmost importance to all you wonderful buyers out there. Today, we’ll be diving into the numbers and exploring how they interact with each other to give you a better understanding of the Hull MA real estate market conditions.
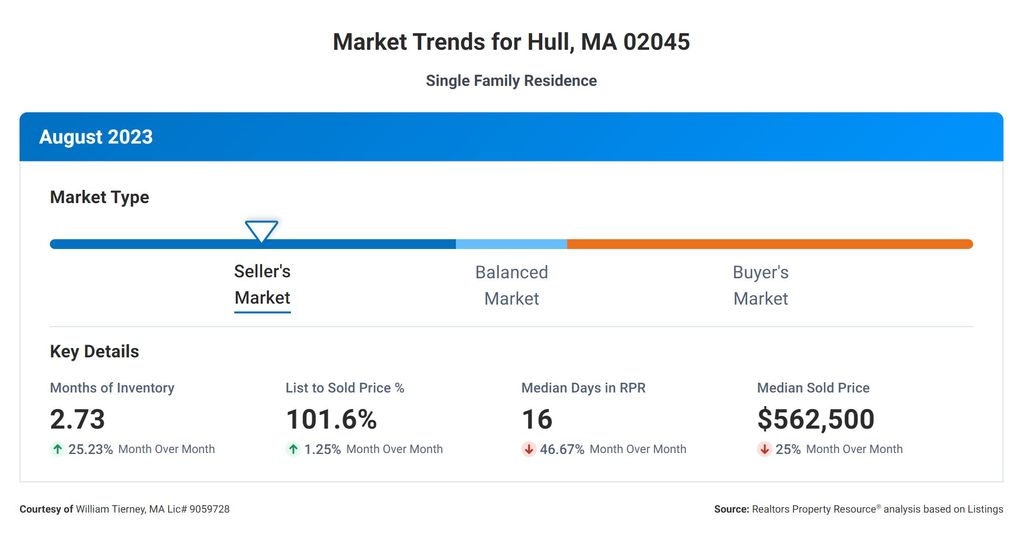
Let’s start with the Months Supply of Inventory, which currently stands at 2.73. This metric represents the number of months it would take to sell all the homes on the market if no new listings were added. A lower number suggests a seller’s market, where demand outpaces supply, and buyers may face more competition.
Now, let’s look at the 12-Month Change in Months of Inventory, which shows an increase of 0.37%. This tells us that over the past year, the supply of homes has slightly increased. While this may indicate a slight shift towards a buyer’s market, it’s important to note that the overall supply remains relatively low.
Moving on, we have the Median Days Homes are On the Market, which is a mere 16 days. This statistic represents the average number of days it takes for a home to go from listing to being sold. With such a low number, it’s evident that properties are being snatched up swiftly, showcasing the high demand in the market.
Now, let’s talk about the List to Sold Price Percentage, which currently sits at a remarkable 101.6%. This means that, on average, homes are selling above their listing price. This can be attributed to the competitive nature of the market, where multiple buyers may be vying for the same property, driving up prices.
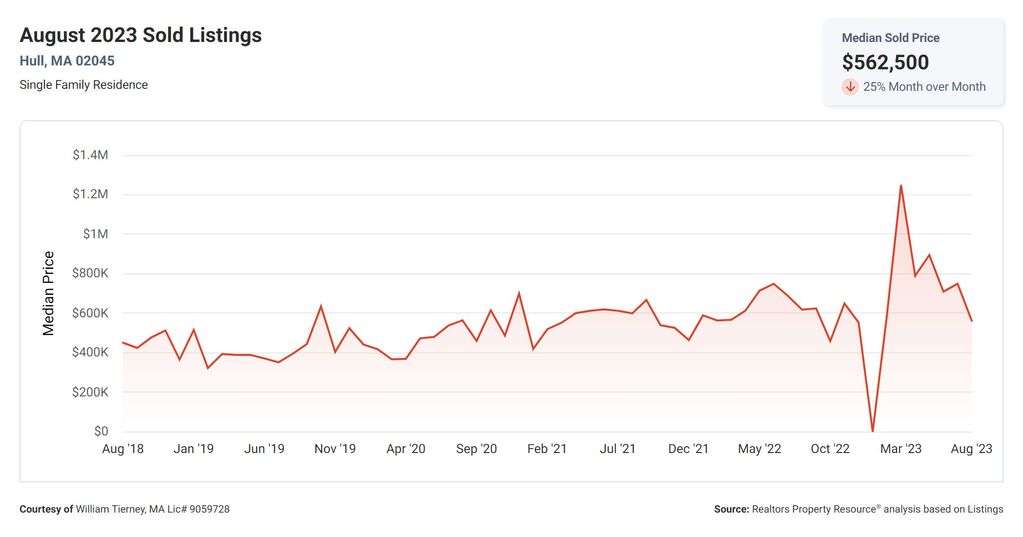
Lastly, we have the Median Sold Price, which stands at a substantial $562,500. This figure represents the middle price point of all homes sold in the market. With a median price like this, it’s clear that the real estate market in this area offers homes with significant value.
Now, let’s tie all these metrics together. The low Months Supply of Inventory suggests a seller’s market, while the slight increase in the 12-Month Change in Months of Inventory hints at a potential shift towards a buyer’s market. However, with the Median Days Homes are On the Market being incredibly low, it’s evident that homes are being snapped up quickly.
Furthermore, the List to Sold Price Percentage being above 100% indicates that buyers may need to be prepared to make competitive offers. And finally, the impressive Median Sold Price showcases that the market is offering homes with substantial value.
Overall, these metrics suggest a dynamic and competitive real estate market. Buyers should be prepared to act swiftly and strategically to secure their dream home. With the right approach, you’ll be able to navigate this exciting market and find a property that meets both your desires and your budget.
Remember, knowledge is power, and understanding these metrics gives you the upper hand in making informed decisions. So, keep an eye on these numbers, stay engaged, and happy house hunting, everyone!