Let’s discuss some fascinating insights into the current Cohasset MA real estate market, specifically tailored for all you sellers out there. So, buckle up and get ready to dive into the world of numbers and trends!
Months of Supply

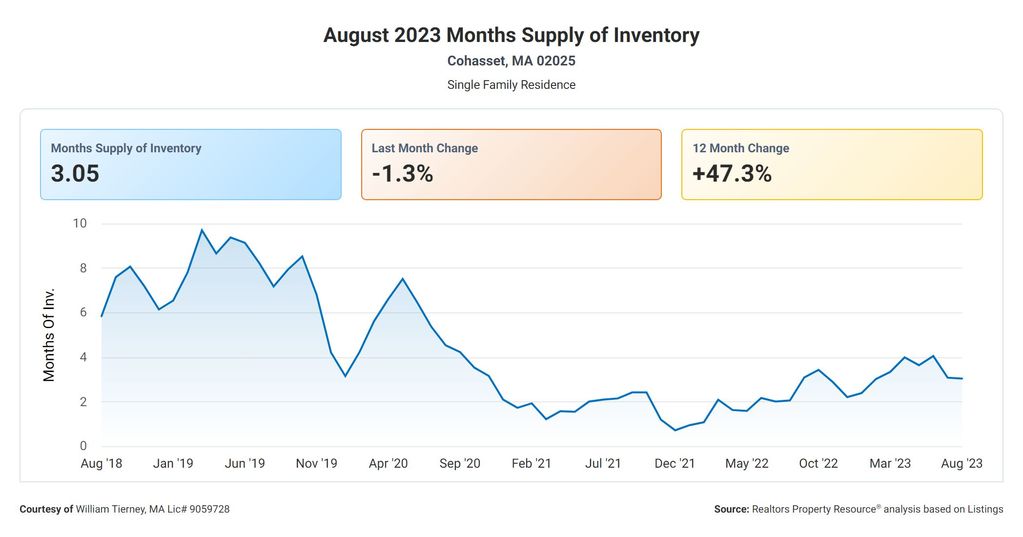
Let’s start with the Months Supply of Inventory, which currently stands at 3.05. This metric measures the number of months it would take to sell all the available homes on the market, assuming no new listings are added. A lower value indicates a seller’s market, where the demand is high and the supply is limited. This means that if you have a property to sell, you are in a favorable position as buyers are actively seeking homes and competition might be fierce.
Now, let’s shift our attention to the 12-Month Change in Months of Inventory, which has seen a remarkable increase of +47.34%. This indicates a significant shift in the market dynamics. The increase suggests that more homes are entering the market, potentially leading to a more balanced market between buyers and sellers. While this may seem like a cause for concern, it also means that buyers have more options to choose from, which could increase your chances of finding the right buyer for your property.
Median Days on the Market

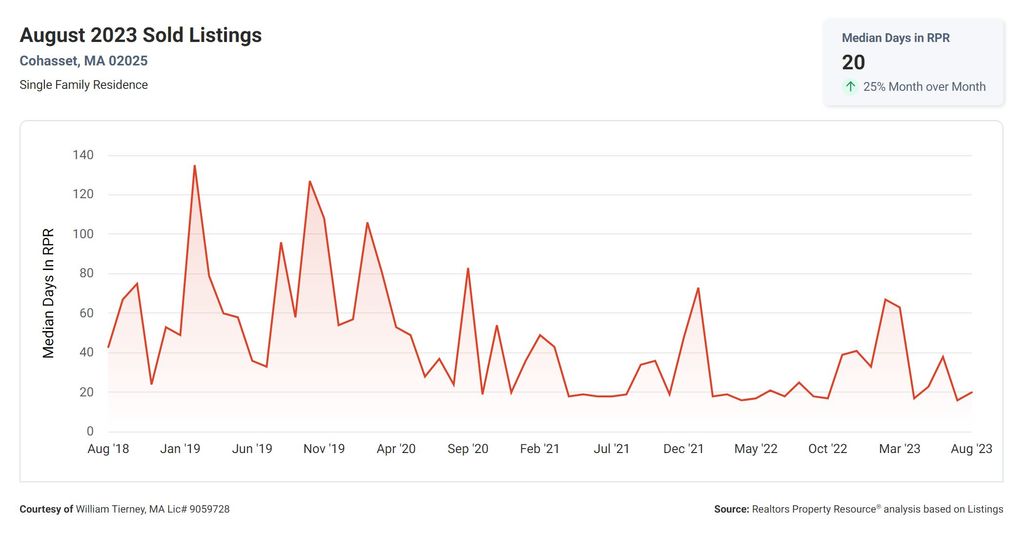
Moving on, let’s talk about the Median Days Homes are On the Market, which currently stands at 20. This metric highlights the average number of days it takes for a home to be sold once it’s listed. A lower value indicates a faster-paced market, where properties are being snatched up quickly. With homes spending only 20 days on the market, it’s clear that buyers are actively engaged and ready to make a move. This speedy turnover could work to your advantage as a seller, as it means a potentially quicker sale for your property.
List to Sale Price Ratio

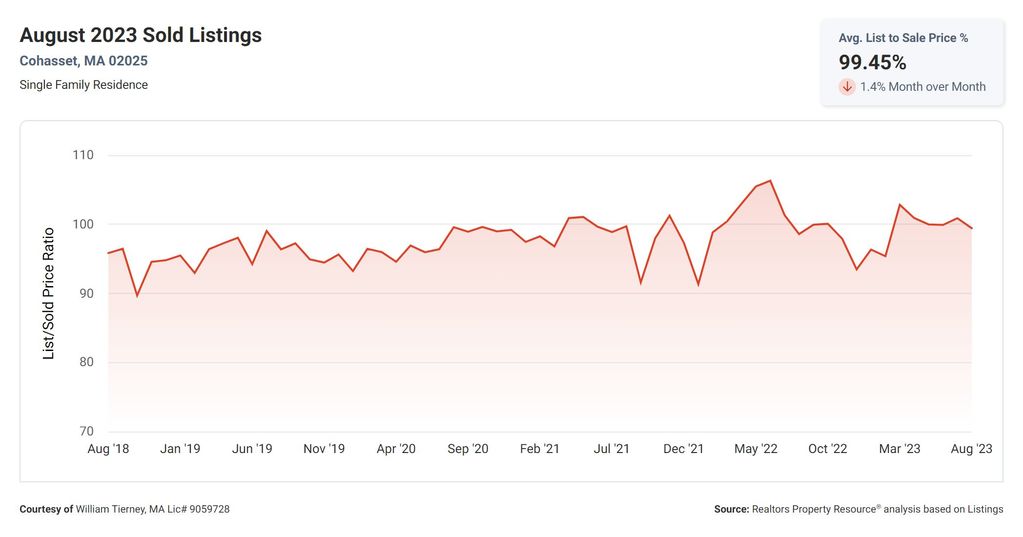
Now, let’s delve into the List to Sold Price Percentage, which sits at an impressive 99.5%. This metric calculates the percentage of the listing price that homes are actually selling for. A higher percentage indicates that sellers are achieving close to or even above their asking price. With a percentage as high as 99.5%, it’s evident that buyers are willing to pay a premium for the properties on offer. This could mean a healthy return on investment for you, the seller, and a testament to the desirability of your property.
Median Sale Price

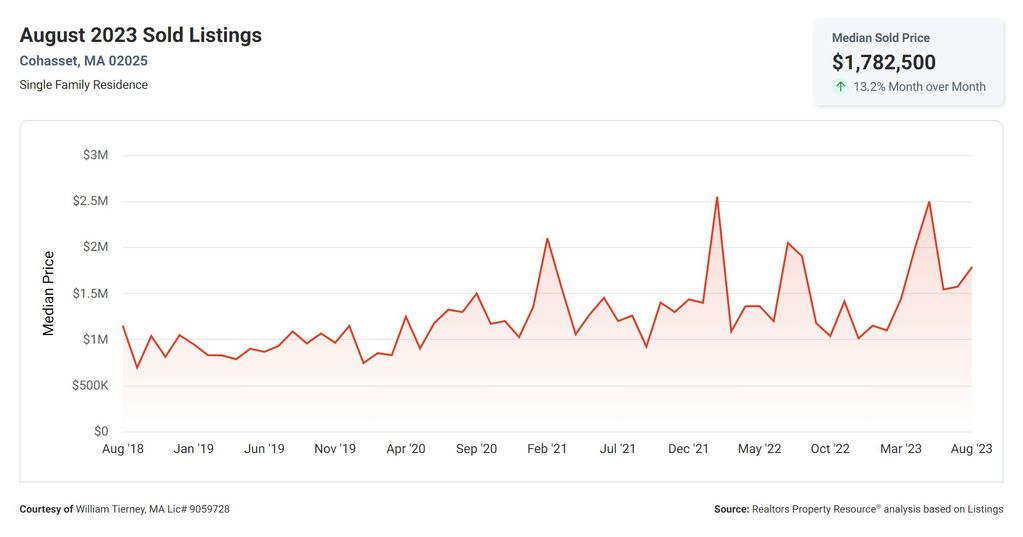
Lastly, let’s touch on the Median Sold Price, which currently stands at a staggering $1,782,500. This metric represents the middle point of all the sold prices in a given time period. This high median sold price indicates that the market is primed for luxury properties, and there is a demand for high-end real estate. If you’re a seller with a high-value property, this could be your chance to capitalize on the market’s appetite for luxury homes.
In conclusion, dear sellers, these real estate metrics paint an intriguing picture of the current market landscape. While there has been an increase in inventory, the market still favors sellers with low months supply of inventory and a high list to sold price percentage. With homes spending minimal time on the market, and buyers willing to pay top dollar, it’s an exciting time to be a seller. So, seize the opportunity, price your property competitively, and get ready to make your mark in this thriving real estate market.
Other Blogs of Interest:
Exploring the Charms of Hingham, Cohasset, and Scituate: A Tale of Three Massachusetts Town


