
Ladies and gentlemen, today we are going to delve into the fascinating world of real estate metrics. Whether you are a buyer or a seller, understanding these metrics can provide valuable insights into the current state of the Cohasset MA real estate market and help inform your decisions. So, let’s dive right in!
Months of Supply
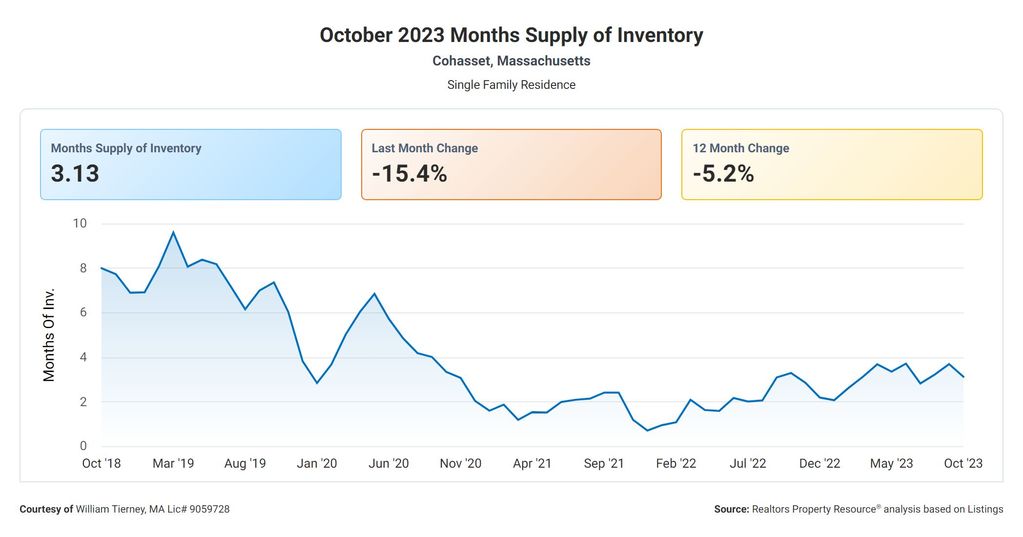
First, let’s take a look at the months supply of inventory, which currently stands at 3.13. This metric represents the number of months it would take to sell all the current inventory of homes on the market, given the current sales pace. In other words, it tells us how balanced the supply and demand are in the market. A lower number suggests a seller’s market, where demand outweighs supply, while a higher number indicates a buyer’s market, where supply exceeds demand.
Now, let’s shift our attention to the 12-month change in months of inventory, which shows a decline of -5.15%. This figure highlights how the supply of homes has changed over the past year. A negative percentage indicates a decrease in inventory, suggesting that homes are being sold at a faster pace than new ones are being listed. This reduction in supply often leads to increased competition among buyers and potentially higher prices.
Median Days on the Market
Moving on, we come to the median days homes are on the market, which currently stands at 81. This metric sheds light on the average amount of time it takes for a home to sell. A shorter number suggests a faster-paced market, where homes are snatched up quickly. Conversely, a longer number indicates a slower market, where homes may linger on the market for a longer period before finding a buyer.
List to Sales Price Ratio
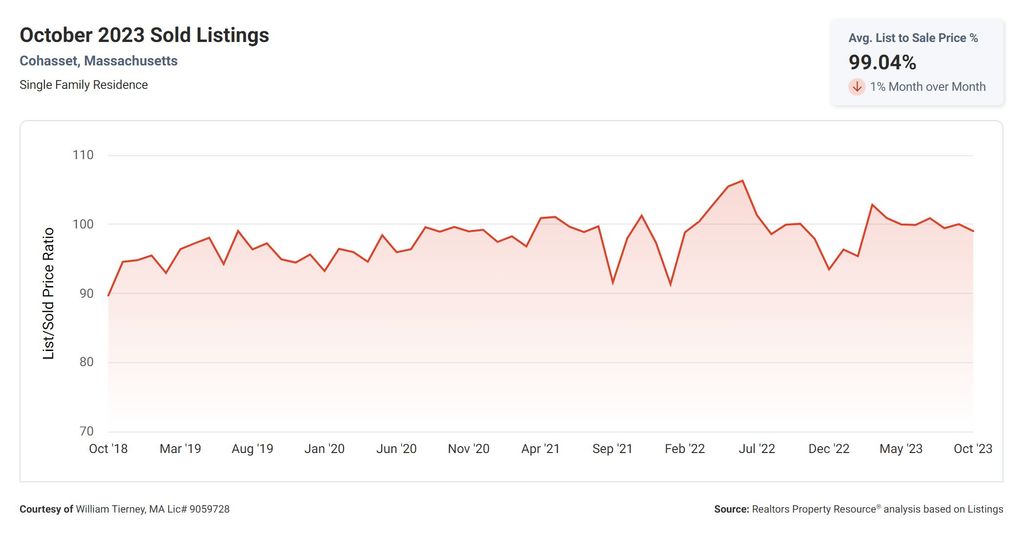
Next up, we have the list to sold price percentage, which currently stands at an impressive 99%. This metric represents the percentage of the list price that homes are actually selling for. A higher percentage indicates that homes are selling very close to their asking price, demonstrating strong buyer interest and potentially multiple offers. This figure can be a useful tool for sellers to gauge how much negotiating power they may have in the current market conditions.
Median Sales Price
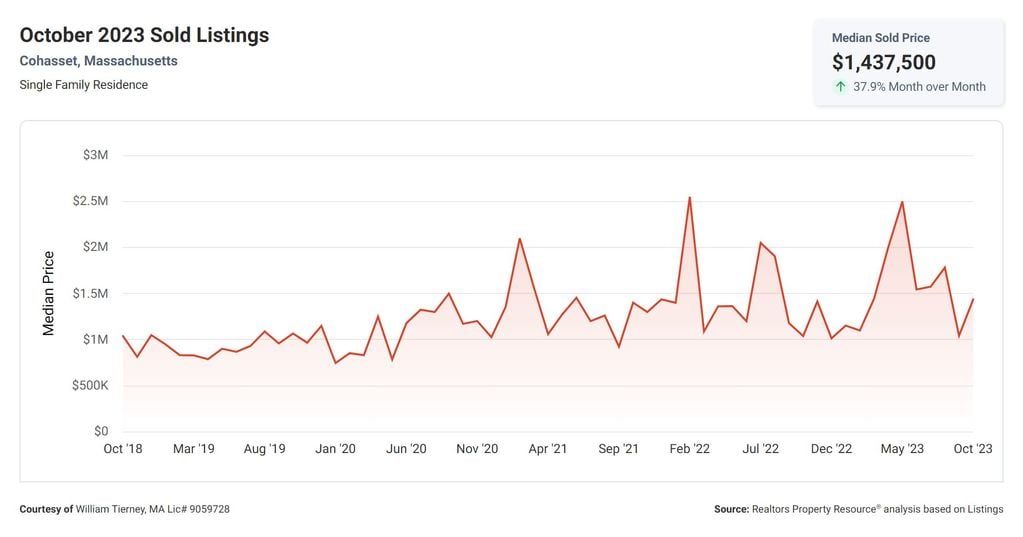
Lastly, we have the median sold price, which currently stands at a substantial $1,437,500. This metric provides a snapshot of the middle point of all the sold prices during a specific time period. It gives us an idea of the overall price range in the market and can be a helpful benchmark for both buyers and sellers. For sellers, it provides an indication of what similar homes are selling for, helping them set an appropriate asking price. For buyers, it offers insight into the market’s affordability and what they can expect to pay for a home.
In conclusion, analyzing these real estate metrics can provide valuable information for both buyers and sellers. Understanding the months supply of inventory, the change in inventory over time, the median days homes are on the market, the list to sold price percentage, and the median sold price can help inform your decisions and give you a competitive edge in the market. So, whether you are buying or selling, make sure to keep these metrics in mind as you navigate the exciting world of real estate.
Other Blogs of Interest
Cohasset for Millennials: A Guide to Living and Working in the Town