Attention Sellers,
I have some exciting news for you regarding the current state of the Hingham MA real estate market. The correlation between these key metrics will surely pique your interest and make you even more eager to sell your property. So let’s dive in and explore the fascinating insights provided by the data.
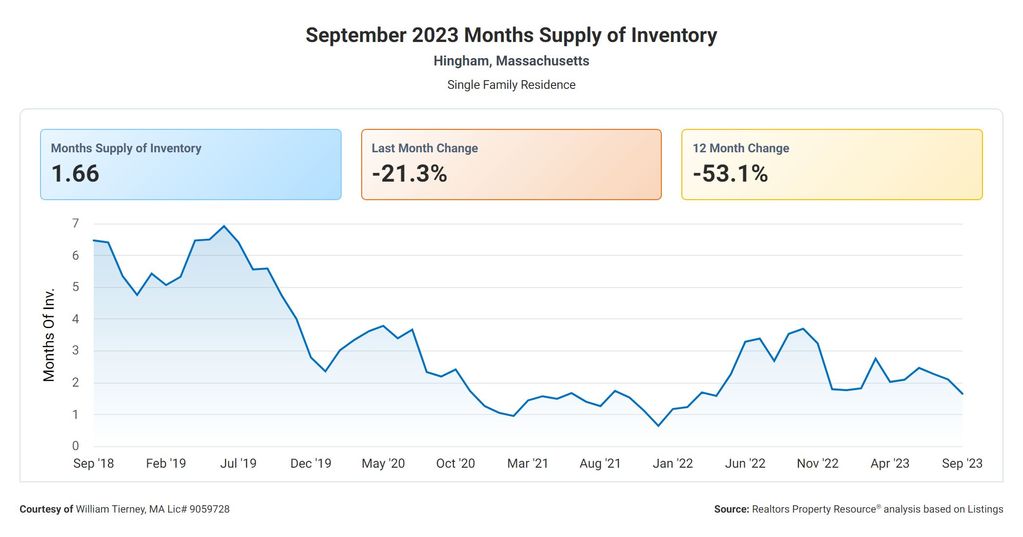
Months of Supply

Firstly, let’s take a look at the Months Supply of Inventory, which currently stands at 1.66. This metric represents the number of months it would take to sell all the available homes on the market in Hingham MA if no new listings were added. A lower number indicates a seller’s market, and in this case, it couldn’t be more evident. With only 1.66 months of inventory available, the demand for homes far outweighs the supply.
Now, brace yourselves for the astounding 12-Month Change in Months of Inventory, which shows a remarkable decrease of 53.11%. This means that over the past year, there has been a significant reduction in the amount of time it takes to sell a home. It’s a clear indication that the market is rapidly shifting in favor of sellers, creating a sense of urgency among buyers.
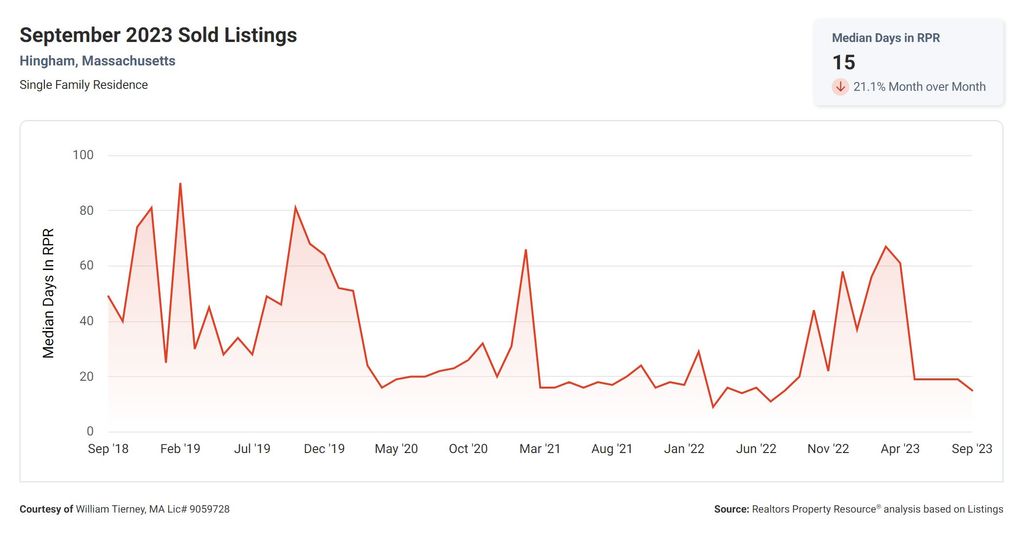
Median Days on the Market

Speaking of urgency, let’s delve into the Median Days Homes are On the Market. Currently, homes are spending a mere 15 days on the market before being snatched up by eager buyers. This incredibly short timeframe is a testament to the high demand and the speed at which properties are being sold. If you’re looking to sell, this metric should give you confidence that your home won’t be sitting idly for long.
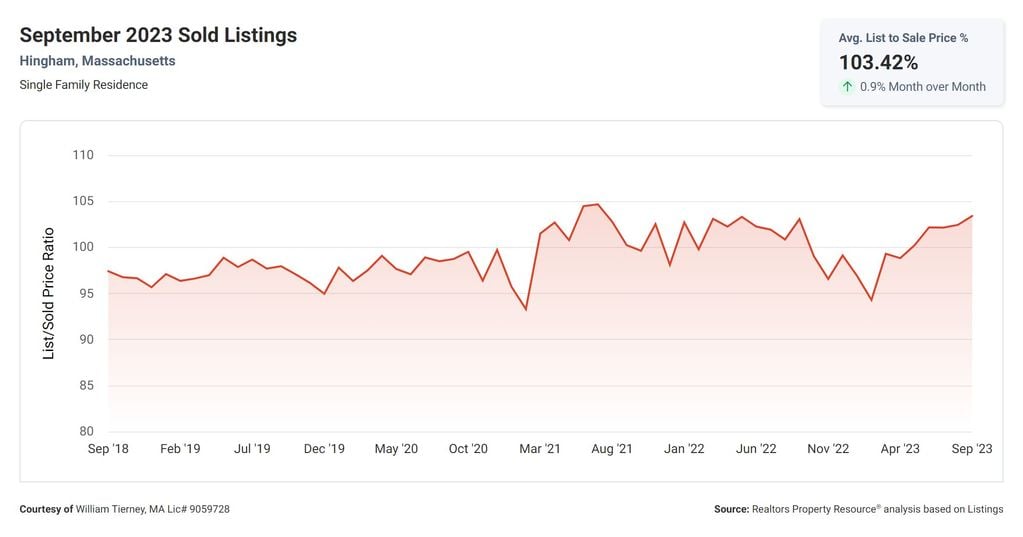
List to Sale Price Ratio

Now, let’s talk numbers. The List to Sold Price Percentage is an impressive 103.4%. This metric represents the percentage of the original listing price that homes are actually selling for. A value above 100% indicates that homes are selling for more than their initial asking price. This is fantastic news for sellers, as it demonstrates the willingness of buyers to pay a premium for desirable properties.
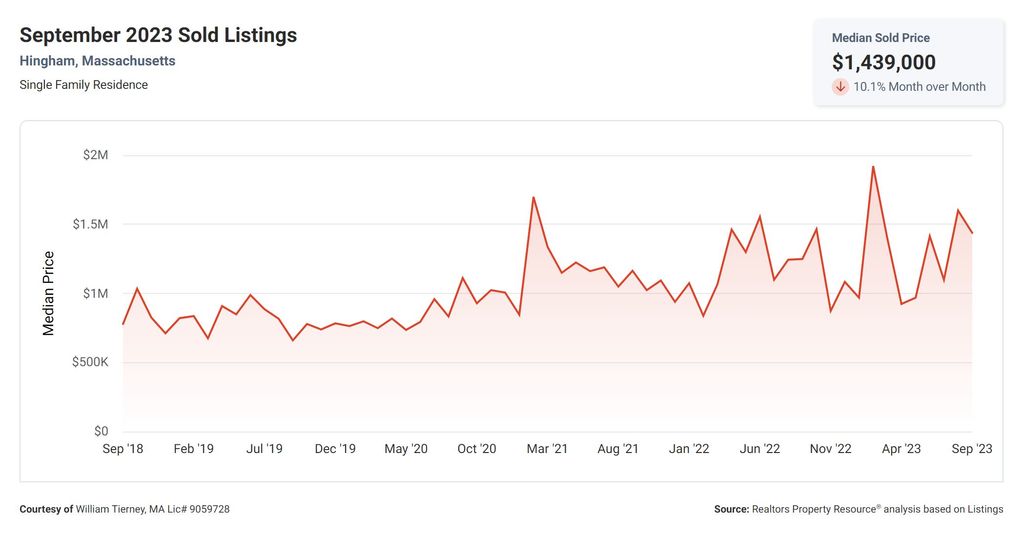
Median Sale Price

Lastly, let’s discuss the Median Sold Price, which currently stands at a jaw-dropping $1,439,000. This figure represents the midpoint of all the home sale prices in the given area. It’s a clear reflection of the high value placed on properties in the current market. If you’re a seller, this metric should excite you, as it suggests the possibility of fetching a handsome sum for your own home.
In conclusion, the correlation between these real estate metrics paints a vivid picture of a flourishing market that heavily favors sellers. With a low Months Supply of Inventory, a significant decrease in the 12-Month Change in Months of Inventory, homes spending only 15 days on the market, a List to Sold Price Percentage above 100%, and a substantial Median Sold Price, it’s clear that now is the perfect time to sell. So, get ready to capitalize on this lucrative opportunity and make the most of the current real estate boom.
Happy selling!


