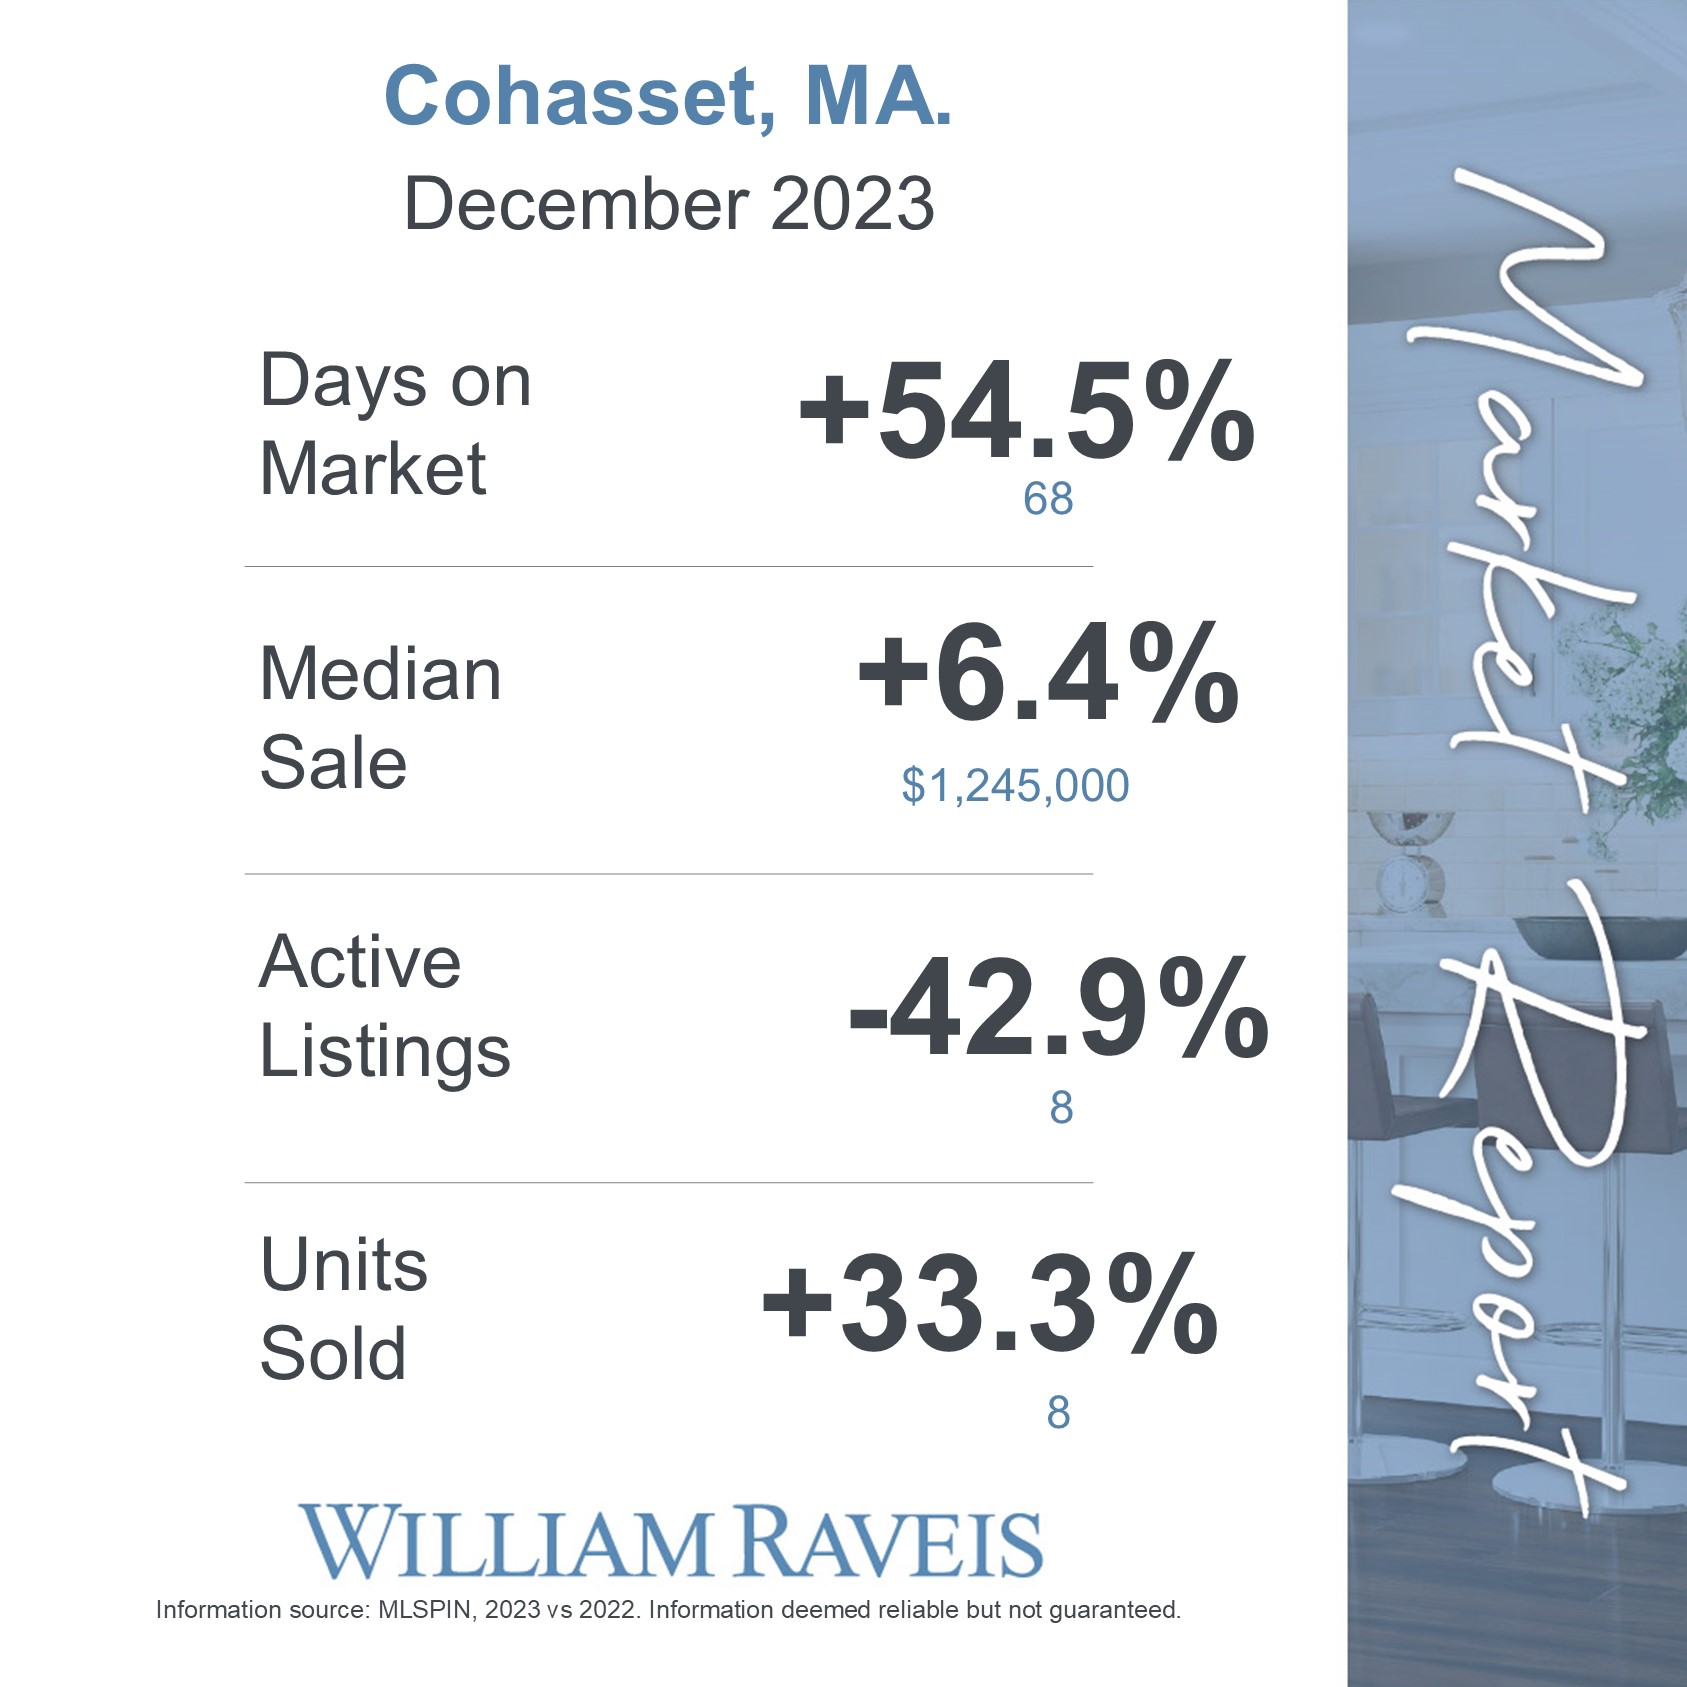
As a seller, you need to understand various real estate metrics that can provide valuable insights into the market conditions. Let’s delve into the correlation between the following metrics to help you gauge the current state of the real estate market and make informed decisions.
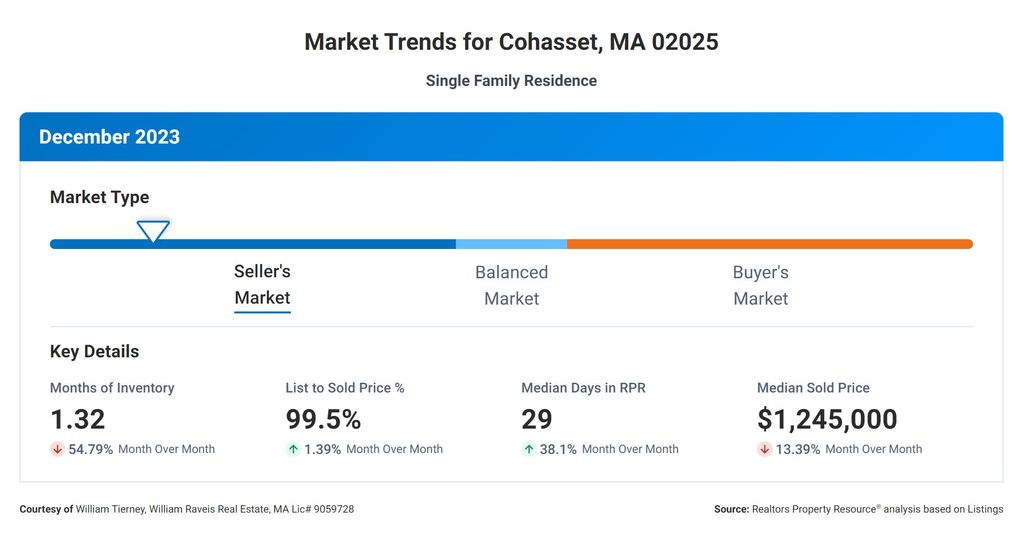
Starting with the Months Supply of Inventory, which is currently at 1.32, this metric measures the number of months it would take for the current inventory of homes on the market to sell, given the current sales pace. A lower number indicates a seller’s market, where demand is high and supply is limited.
Now, let’s look at the 12-Month Change in Months of Inventory, which is showing a decrease of 40%. This percentage indicates the change in the supply of homes over a year. In this case, the decrease suggests a significant reduction in the number of homes available for sale compared to the previous year. This decline in inventory can often lead to increased competition among buyers, potentially driving up prices.
Moving on to the Median Days Homes are On the Market, which currently stands at 29. This metric provides an average number of days it takes for a home to go from listing to being under contract. A lower number signifies a faster-paced market, indicating that properties are selling relatively quickly. This could be a positive sign for sellers, suggesting high demand and a favorable market for selling their homes.
Next, let’s discuss the List to Sold Price Percentage, which is currently at 99.5%. This metric represents the percentage of the final listing price at which a property is sold. A higher percentage indicates that sellers can expect to receive a higher percentage of their asking price. In this case, a 99.5% percentage suggests that sellers are achieving nearly their full asking price, which is a positive indicator of a strong market and potentially multiple offers on properties.
Lastly, we have the Median Sold Price, which is currently $1,245,000. This metric represents the middle point of all the sold prices in a given area or market. It provides an overview of the average price at which homes are sold. A higher median sold price indicates a more expensive market, potentially benefiting sellers who are looking to fetch a higher price for their properties.
In summary, the correlation between these real estate metrics paints a promising picture for sellers. With a low Months Supply of Inventory, a decrease in the 12-Month Change in Months of Inventory, a relatively quick Median Days Homes are On the Market, a high List to Sold Price Percentage, and a healthy Median Sold Price, it suggests a strong seller’s market with high demand, limited supply, and the potential for sellers to achieve favorable prices for their homes.