Hey there, buyers! Let’s dive into some interesting real estate metrics that can give you valuable insights into the current market trends. By analyzing these numbers, you can gain a better understanding of the correlation between different aspects of the real estate market and make more informed decisions. So, let’s get started!
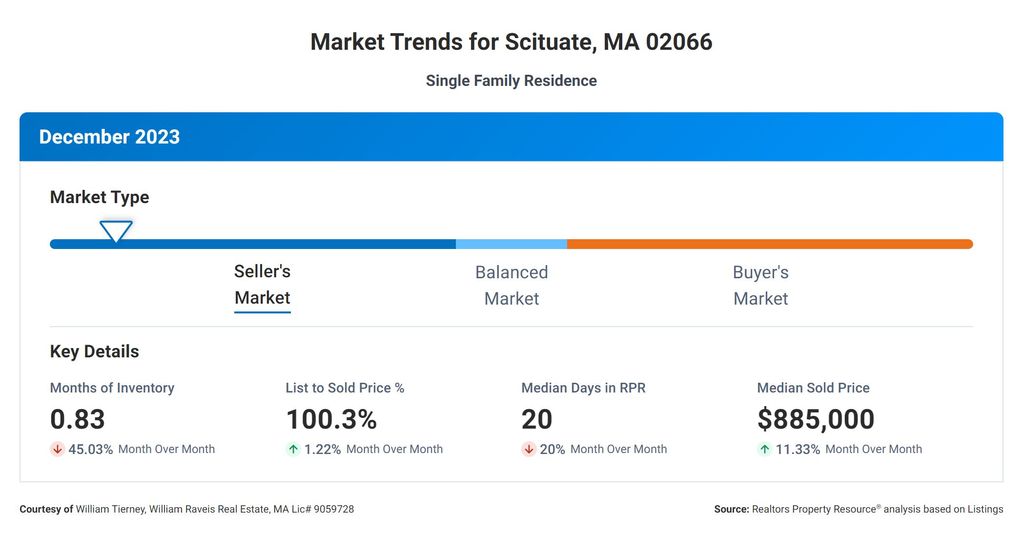
First, let’s take a look at the “Months Supply of Inventory,” which currently stands at 0.83. This metric represents the number of months it would take to sell all the available homes on the market at the current sales pace. A low months supply of inventory indicates a seller’s market, where demand for homes exceeds supply. With a 0.83 months supply, we can conclude that the market is highly competitive, and buyers may face limited options. This scarcity of inventory can result in increased competition and potentially drive up prices.
Now, let’s consider the “12-Month Change in Months of Inventory,” which shows a significant decrease of -59.51%. This indicates a substantial decline in the number of months it would take to sell all available homes compared to the previous year. A negative change like this suggests a tightening market with fewer homes available for sale. As a buyer, this means you’ll need to act swiftly when you find a property that meets your needs, as the inventory is moving quickly.
Moving on, the “Median Days Homes are On the Market” is currently at 20. This metric represents the average number of days it takes for a home to go from listing to being sold. With a relatively low number of days, it suggests that homes are selling at a brisk pace. This fast turnover may be attributed to the high demand and limited inventory we mentioned earlier. As a buyer, it’s essential to be prepared and act promptly when you find a home you’re interested in.
Next, let’s explore the “List to Sold Price Percentage,” which stands at 100.3%. This metric measures the percentage of the listing price that a home ultimately sells for. A value above 100% indicates that homes are selling for more than their initial list price. This suggests a competitive market where buyers may need to offer higher prices to secure a property. It’s crucial to consider this when budgeting and negotiating to ensure you’re prepared to make competitive offers.
Lastly, the “Median Sold Price” is $885,000. This metric represents the middle point of all the homes sold in the given period, indicating the midpoint of the price range. With a median sold price of $885,000, it suggests that the market consists of a mix of higher and lower-priced homes. It’s essential to keep this average in mind when considering your budget and understand that prices can vary depending on various factors such as location, size, and condition of the property.
To summarize, the real estate metrics we’ve discussed provide a snapshot of the current market conditions. With a low months supply of inventory, a significant decrease in the number of available homes, and a fast turnover rate, it’s evident that the market is highly competitive. Additionally, the list to sold price percentage above 100% indicates a need for competitive offers. However, with a median sold price of $885,000, the market offers a range of options for buyers. By staying informed and being prepared to act quickly, you can navigate this dynamic market and find the perfect home for your needs. Happy house hunting!