Hello, real estate fans! As sellers in the real estate market, it is essential for you to understand the correlation between various real estate metrics. Today, we have some intriguing data that will shed light on the current state of the Hingham MA real estate market and its impact on your selling experience.
Months of Supply
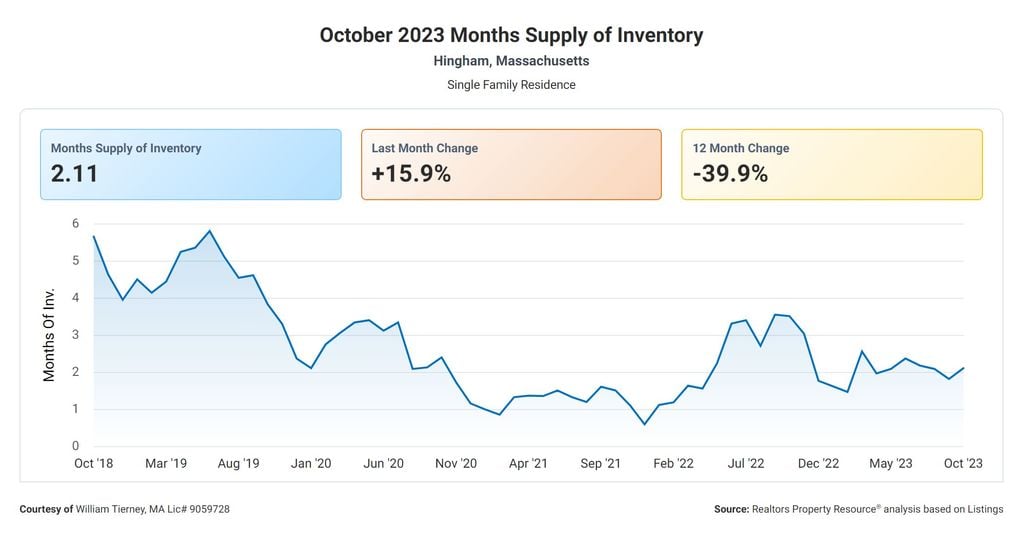
Let’s start with the Months Supply of Inventory, which stands at 2.11. This metric represents the number of months it would take to sell all the currently listed properties if no new properties were added to the Hingham MA real estate market. A lower number indicates a seller’s market, where demand exceeds supply, and homes are selling quickly.https://larnardrealestate.com/communities/hingham/
Now, let’s delve into the 12-Month Change in Months of Inventory, which shows a significant decrease of -39.89%. This decrease indicates a substantial shift in the market dynamics, leading to a tighter supply of homes available for purchase. This trend suggests that the Hingham MA real estate market is becoming even more favorable for sellers, as the demand continues to outpace the supply.
Median Days On The Market
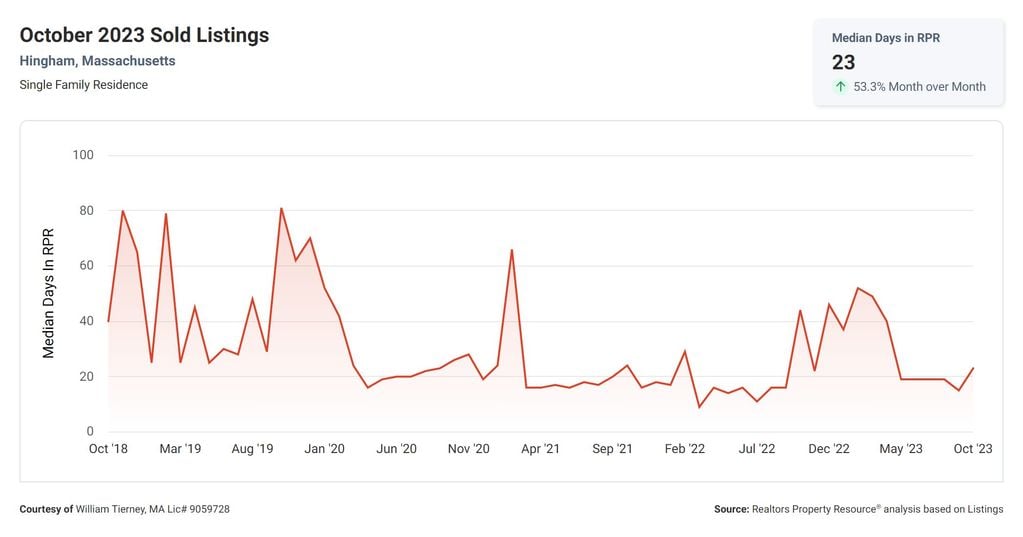
Moving on, the Median Days Homes are On the Market is a remarkable 23 days. This metric showcases the average number of days it takes for a property to sell. With such a short period, it is evident that homes are being snatched up at a rapid pace. Sellers can take comfort in knowing that their properties are likely to attract interested buyers swiftly.
Another crucial factor to consider is the List to Sold Price Percentage, which stands at an impressive 100%. This metric signifies that Hingham homes are selling at their listed price, without any significant price reductions. It demonstrates the strong confidence buyers have in the current market, as they are willing to pay the full asking price for properties they desire.
Median Sold Price
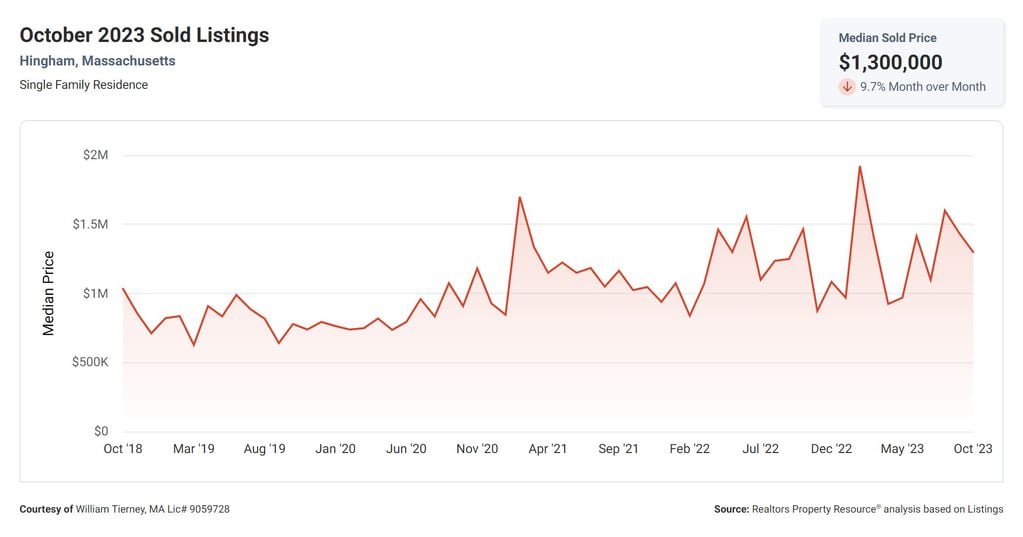
Lastly, let’s discuss the Median Sold Price, which sits at a remarkable $1,300,000. This figure represents the middle price point of all the homes sold in the market. This high median sold price indicates that sellers have the opportunity to achieve substantial financial gains from their properties.
In conclusion, the correlation between these real estate metrics paints a promising picture for sellers in the current market. With a low Months Supply of Inventory, a significant decrease in the 12-Month Change in Months of Inventory, a short Median Days Homes are On the Market, a List to Sold Price Percentage of 100%, and a high Median Sold Price, sellers can confidently enter the market with the expectation of swift sales at favorable prices.
Thank you for your attention, and we hope this analysis has provided you with valuable insights into the current state of the real estate market.
Other blogs of interest:
Navigating the Cohasset MA Real Estate Market: The Power of ARM Loans