Good afternoon, Sellers. Today, we will be discussing some key Scituate MA real estate metrics that can greatly impact the sale of your property. These metrics provide valuable insights into the current market conditions and can help you make informed decisions when it comes to pricing and timing your sale.
Months of Supply
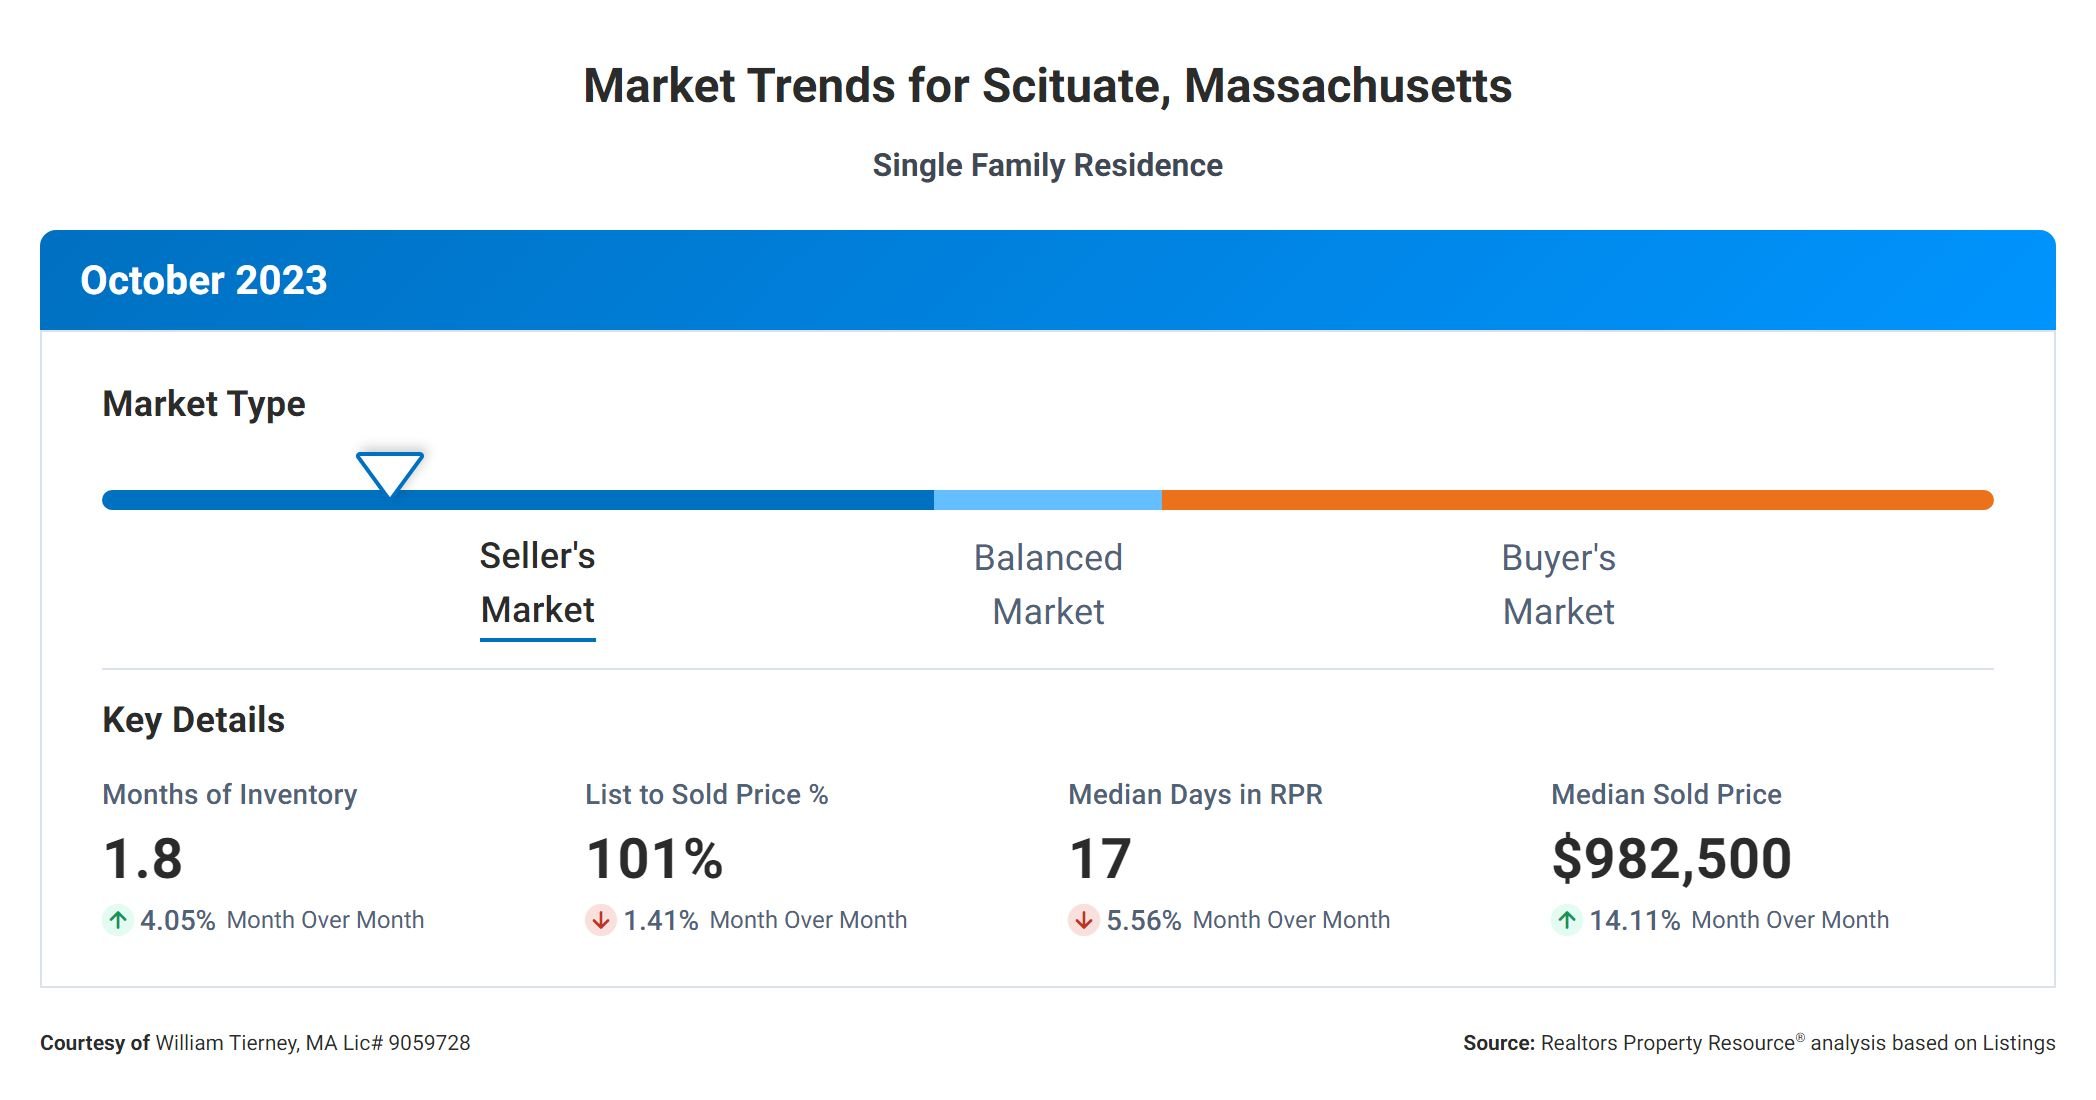
Let’s begin by examining the “Months Supply of Inventory.” This metric indicates the number of months it would take to sell all the current listings on the market if no new properties were added. In this case, the months supply of inventory is 1.8. A lower value suggests a seller’s market, where demand exceeds supply, potentially leading to quicker sales and higher prices.
Now, let’s delve into the “12-Month Change in Months of Inventory,” which stands at -42.31%. A negative value in this metric suggests a significant decrease in the number of available properties over the past year. This decline can be attributed to various factors, such as increased demand, limited new construction, or a surge in buyer activity. As a seller, this decrease in supply can work in your favor, as it may lead to increased competition and potentially higher sale prices.
Median Days On The Market
Another essential metric to consider is the “Median Days Homes are On the Market,” which currently stands at 17. This figure represents the average number of days it takes for a property to sell on the Scituate MA real estate market. The lower the number, the faster the sales process. With a median of just 17 days, it is clear that there is a high demand for properties in this market. This information should encourage you as a seller, to know that your property is likely to attract attention and find a buyer relatively quickly.
List to Sale Price Ratio
Moving on, let’s focus on the “List to Sold Price Percentage,” which is currently at 101%. This metric indicates the percentage of the original listing price that sellers are able to obtain when their property sells. A value higher than 100% suggests that sellers are achieving prices higher than their initial asking price. This can be a positive sign for you as a seller, as it indicates that buyers in this market are willing to pay a premium for desirable properties.
Median Sale Price
Finally, let’s look at the “Median Sold Price,” which is currently at $982,500. This metric represents the midpoint of all the sold prices in a given period. The median sold price helps you understand the price range at which most properties are selling. In this case, the median sold price indicates that there is a strong market for higher-priced properties. As a seller, this information can guide your pricing strategy and help you set realistic expectations regarding the potential value of your property.
To summarize, the real estate metrics we have discussed today paint a positive picture for sellers in this market. With a low months supply of inventory, a significant decrease in the number of available properties, a short time on the market, a list-to-sold price percentage above 100%, and a healthy median sold price, it is evident that demand is high, and sellers have the upper hand. This information should give you confidence and motivation as you navigate the selling process.
Thank you for your attention, and we wish you the best of luck with your real estate endeavors.
Other Blogs of Interest
Exploring the Outdoors: A Guide to Scituate’s Parks and Beaches
Exploring Cohasset’s Vibrant Art Scene: A Guide to Galleries and Museums