The Scituate MA Real Estate Market Report for August 2023
September 12, 2023
September 12, 2023
Attention Sellers,
Today, we are going to dive into some key real estate metrics that will give you a better understanding of the current market conditions and how they can impact your selling experience. So, let’s get started!
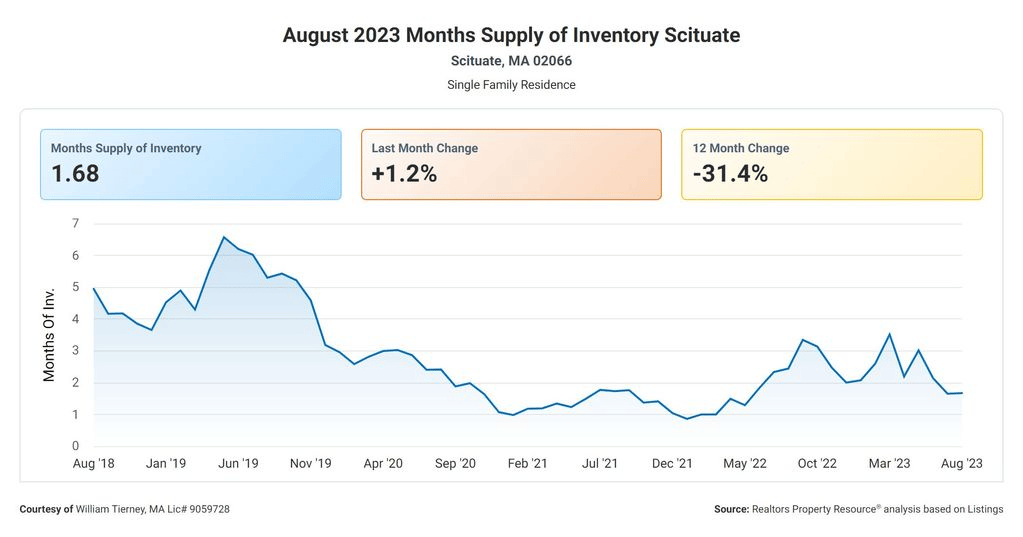
First, let’s talk about the “Months Supply of Inventory.” This metric tells us how long it would take to sell all the homes on the market if no new listings were added. Currently, the months supply of inventory stands at 1.68. This means that if no new homes were listed, it would take just about 1.68 months for all the available properties to be sold.
Now, let’s look at the “12-Month Change in Months of Inventory.” This metric gives us insight into how the supply of homes has changed over the past year. And guess what? It’s good news for you, sellers! The 12-month change in months of inventory is showing a decrease of 31.43%.
This means that compared to the same time last year, there are significantly fewer homes available for sale. This shortage of inventory can create a sense of urgency among buyers, potentially leading to a more competitive selling environment.
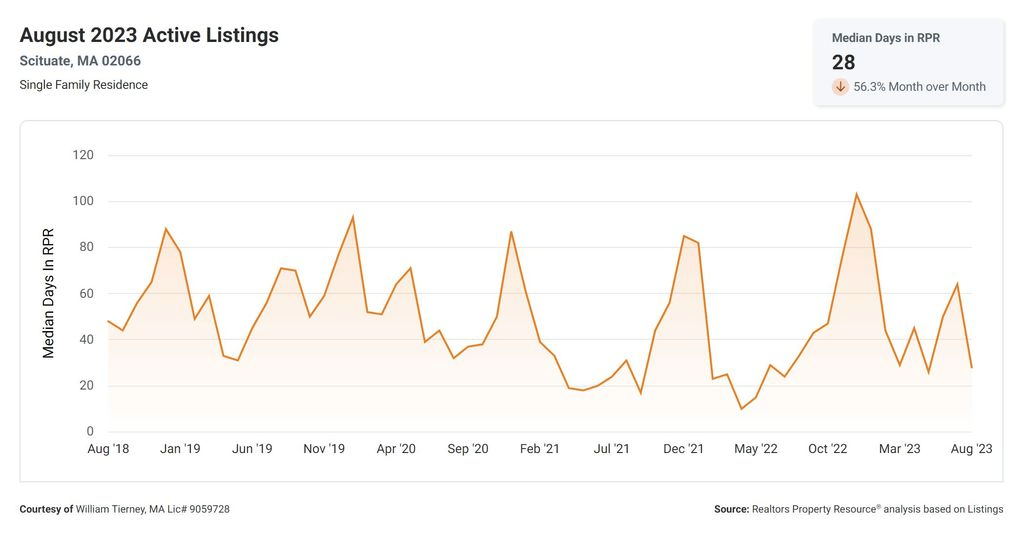
Moving on, we have the “Median Days Homes are On the Market.” This metric reveals the average number of days it takes for a home to go from listing to being sold. Currently, homes are spending an average of just 19 days on the market.
This is a clear indication of a fast-paced market where properties are being snatched up quickly. If you’re looking to sell, this means you may see a quicker turnaround time and less time waiting for offers to come in.
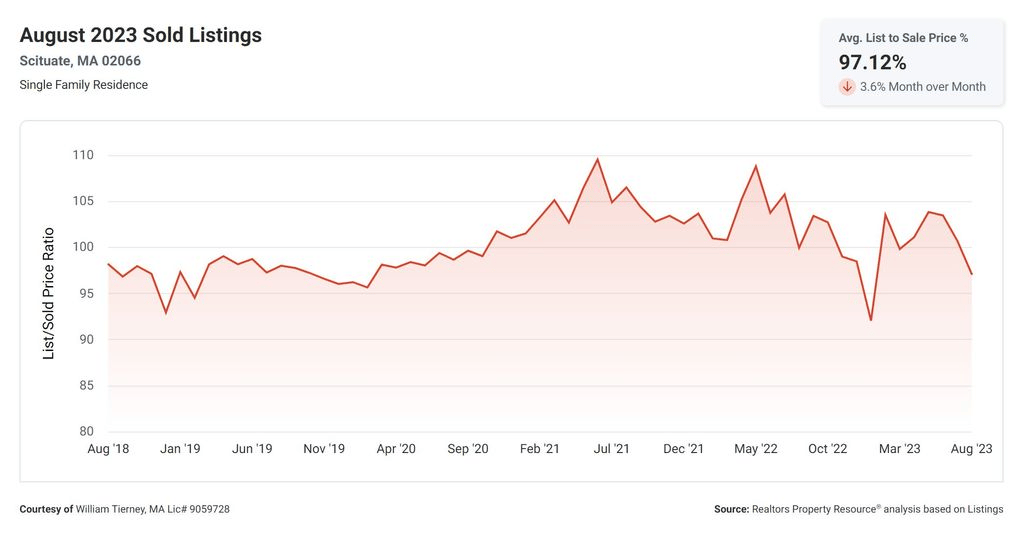
Next, let’s discuss the “List to Sold Price Percentage.” This metric represents the percentage of the listing price that a home ultimately sells for. Currently, homes are selling for an impressive 97.1% of their listed price. This suggests that sellers are able to secure a high percentage of their asking price, which is great news for your bottom line.
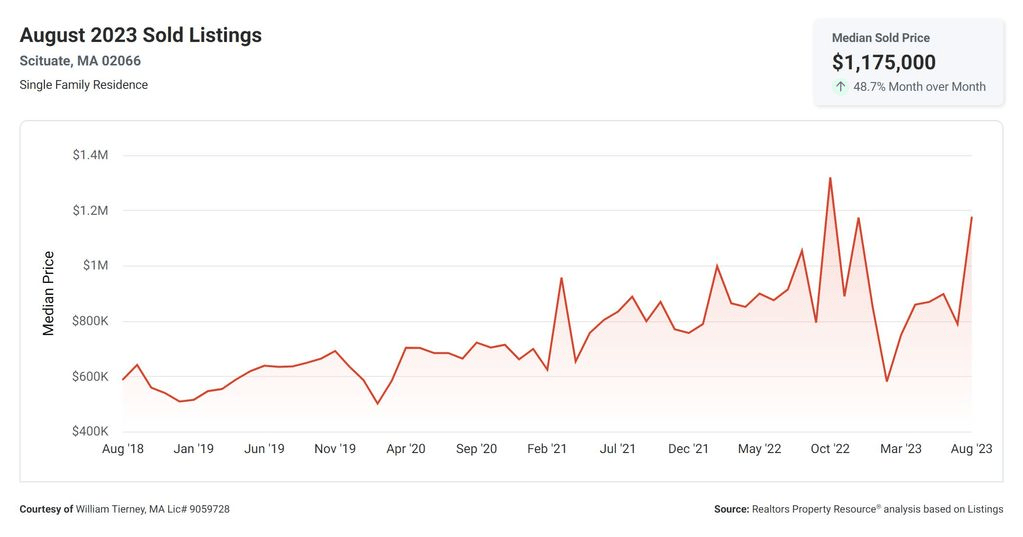
Last but certainly not least, we have the “Median Sold Price.” The median sold price is currently sitting at a handsome $1,175,000. This means that half of the sold homes in the area have sold for prices above this figure, and half have sold for prices below it. This strong median sold price indicates a healthy and robust real estate market, where sellers have the potential to fetch a significant return on their investment.
In summary, the data paints a picture of a seller’s market with low inventory, quick sales, high list-to-sold price percentages, and strong median sold prices. These metrics suggest that now may be an opportune time for you to sell your property. With limited supply and high demand, you have the potential to sell quickly and at a favorable price.
So, if you’re considering selling your home, seize the moment and take advantage of the current market conditions. The data is on your side, and there’s no better time than now to make your move.
Good luck, and happy selling!

Review the January 2021 Scituate real estate market report with local home sales and pricing data.

Discover the best local ice cream stands in and around Cohasset for delicious sweet summer treats.

Weigh the benefits and risks of dual agency to decide if it fits your real estate transaction goals.

Discover the key differences between home valuations and appraisals before selling your real estate.

When it comes to the List to Sold Price percentage, we're currently at an impressive 101.6%!

The dogs burn off some energy. The humans clear their heads. Everyone is ready for lunch.

The farm has become an important educational and community resource throughout the South Shore.

Cohasset is not the kind of place you experience by racing from one attraction to the next.

Enjoy everything from waterfront yoga and live music to fresh seafood and farmers' markets.
While I am not a native of Cohasset, I am very entrenched here. I can find you the right house, bank, builder, school, yoga studio, and yes, even the freshest organic ingredients for a good meal.