Ladies and gentlemen, today we will delve into the fascinating world of real estate metrics and explore the correlation between various factors that significantly impact both buyers and sellers in the Hull MA real estate market. So sit back, relax, and allow me to guide you through this captivating analysis.
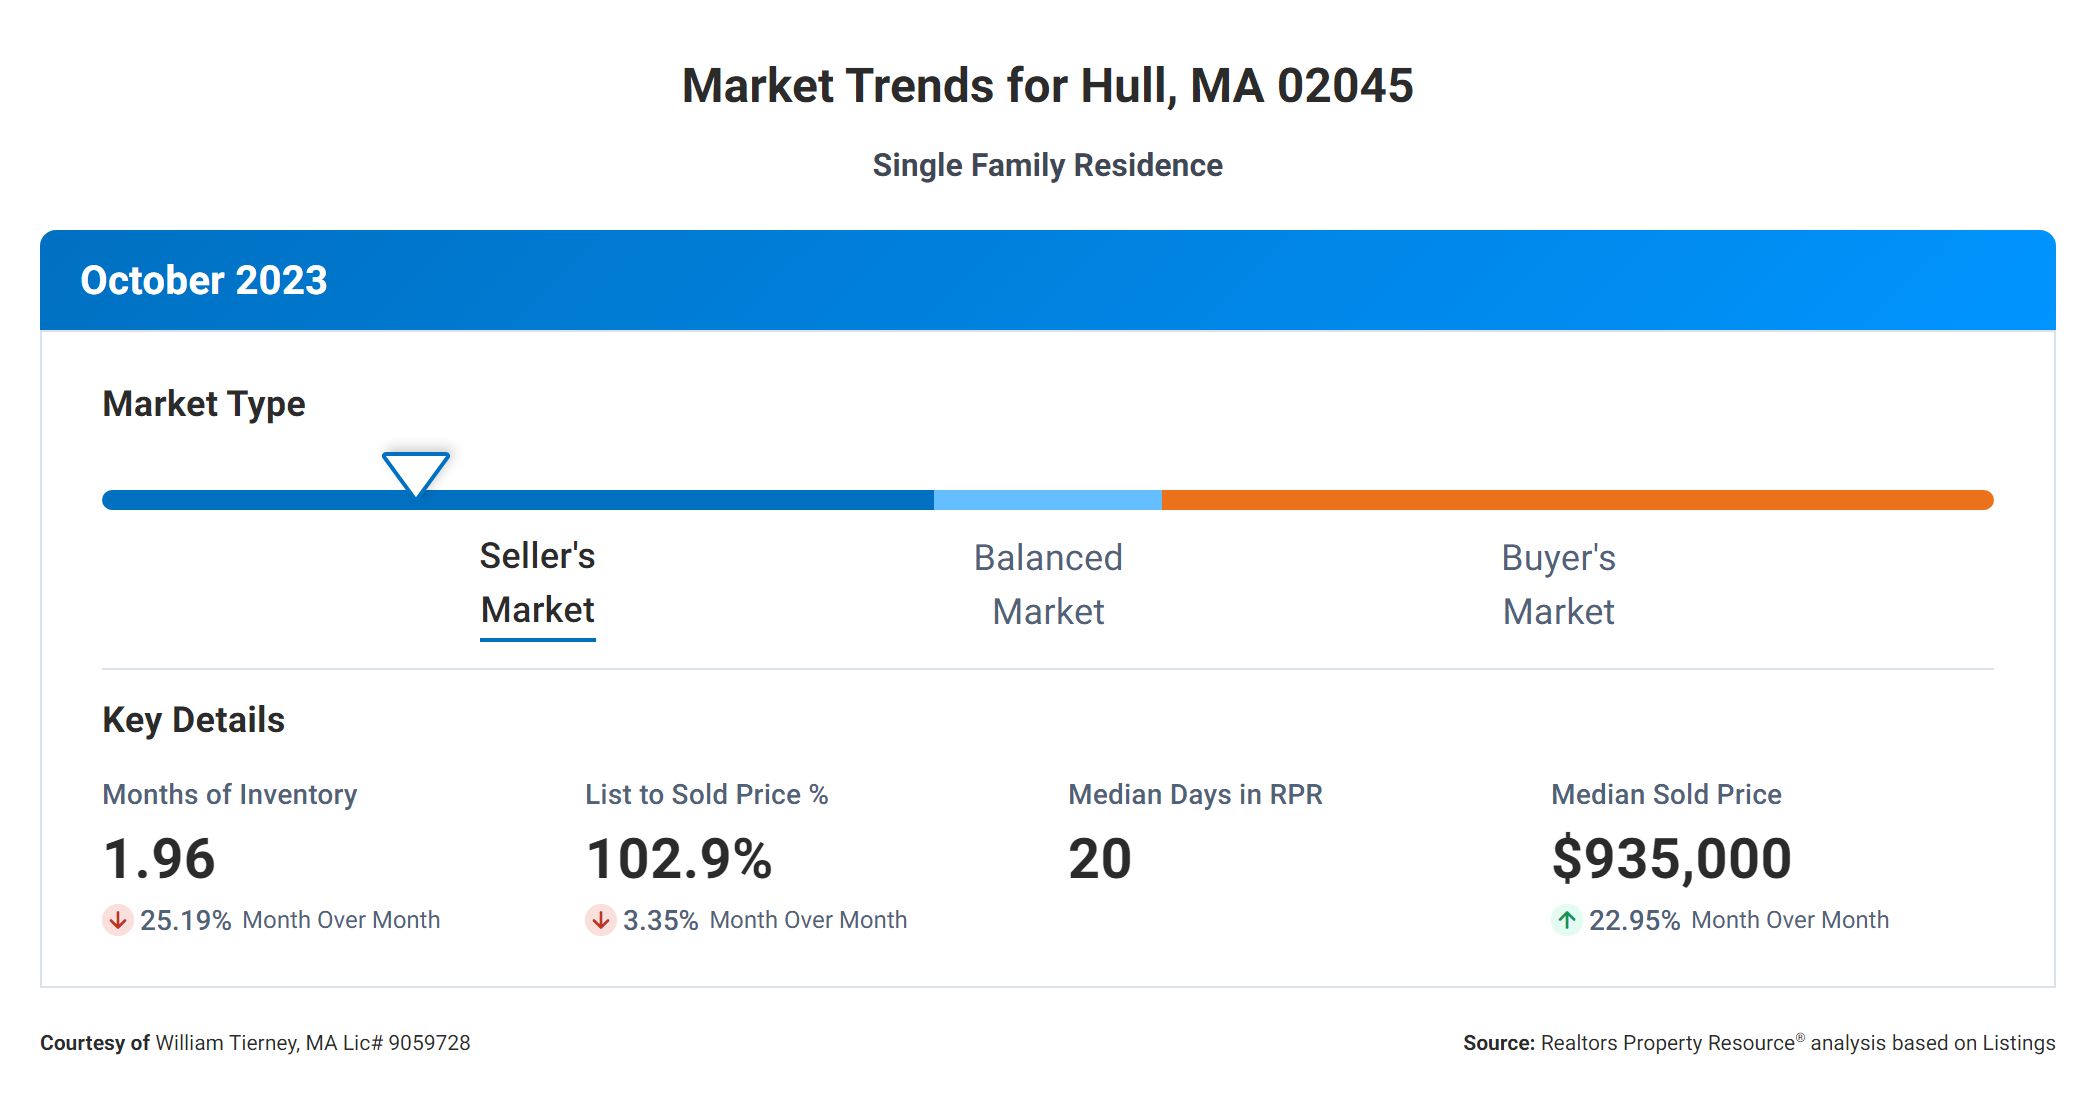
Let’s begin with the “Months Supply of Inventory,” which currently stands at an impressive 1.96. This metric represents the number of months it would take to sell all the homes on the Hull MA real estate market if no new listings were added. A lower value suggests a seller’s market, indicating a high demand for homes. In our case, with a months supply of 1.96, it’s evident that the market is quite competitive, favoring sellers.
Now, let’s move on to the “12-Month Change in Months of Inventory,” which shows a remarkable decrease of -27.94%. This decrease indicates that the supply of available homes has been steadily declining over the past year. This decline further reinforces the notion of a seller’s market, as the demand for homes continues to outpace the supply.
Next, we come to the “Median Days Homes are On the Market,” which currently stands at a mere 20 days. This metric provides valuable insights into the speed at which Hull MA homes are being sold. With a median of just 20 days, we can confidently say that homes are being snapped up quickly, underscoring the high demand in the Hull MA real estate market.
Moving on, we have the “List to Sold Price Percentage,” which stands at an impressive 102.9%. This percentage represents the ratio of the final sold price to the initial listing price. With a value above 100%, it indicates that homes are selling for more than their listed price on average. This statistic highlights the strong negotiating power of sellers and the willingness of buyers to compete in order to secure their desired property.
Lastly, we have the “Median Sold Price,” which currently stands at a substantial $935,000. This metric provides an essential snapshot of the market’s overall price levels. With a median sold price nearing $1 million, it’s clear that the real estate market in question is operating at a higher price range. This information is crucial for both buyers and sellers as they navigate their respective positions.
As we examine the correlation between these metrics, it becomes evident that the current market heavily favors sellers. With limited inventory, homes are selling rapidly, often above their listed prices. This robust demand has led to a decrease in the months supply of inventory, indicating a competitive market. Furthermore, the high median sold price illustrates the premium buyers are willing to pay for properties in this area.
For buyers, this analysis underscores the need for swift decision-making and diligent preparation when entering the market. Additionally, it is crucial for sellers to capitalize on the favorable conditions by pricing their homes strategically and leveraging the strong demand to achieve optimal selling prices.
In conclusion, this analysis of real estate metrics has shed light on the current market dynamics, revealing a strong seller’s market with high demand, limited supply, and increasing prices. Understanding these correlations is essential for buyers and sellers alike, as it empowers them to make informed decisions in this dynamic and ever-evolving real estate landscape.